I recently read this alarming report in Perspectives on
Psychological Science (Kievit, 2011):
A group of international Bayesians was
arrested today in the Rotterdam harbor. According to Dutch customs,
they were attempting to smuggle over 1.5 million priors into the
country, hidden between electronic equipment. The arrest represents
the largest capture of priors in history.
“This is our biggest catch yet. Uniform
priors, Gaussian priors, Dirichlet priors, even informative priors,
it’s all here,” says customs officers Benjamin Roosken,
responsible for the arrest. (…)
Sources suggest that the shipment of priors
was going to be introduced into the Dutch scientific community by
“white-washing” them. “They are getting very good at it. They
found ghost-journals with fake articles, refer to the papers where
the priors are allegedly based on empirical data, and before you know
it, they’re out in the open. Of course, when you look up the
reference, everything is long gone,” says Roosken.
This fake report is quite possibly the geekiest joke in the
history of man, so you're forgiven if you don't get it right away.
It's about statistics, so a very
brief introduction is in order.
Psychologists typically investigate whether two groups (or one
group under two conditions) differ from each other in some respect.
For example, they may investigate whether men and women differ in
their cleaning habits, by comparing the number of times that men and
women vacuum each week. Here's some fake data for 6 participants (3
men and 3 women):
Men: 2 …

 The first experiment is most compelling, so I will give you a few
details. Participants were asked questions that were either easy or
difficult. After a series of questions, all of approximately the same
difficulty, participants performed a Stroop-like task. In this task,
participants had to name the colors of words. Like this:
The first experiment is most compelling, so I will give you a few
details. Participants were asked questions that were either easy or
difficult. After a series of questions, all of approximately the same
difficulty, participants performed a Stroop-like task. In this task,
participants had to name the colors of words. Like this: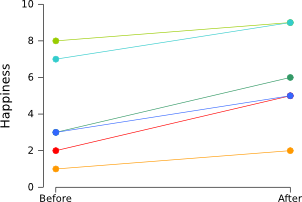
![A view of a skull, drawn by Leonardo da Vinci. Source [url=http://commons.wikimedia.org/wiki/File:View_of_a_Skull_III.jpg]Wikimedia Commons[/url]](/images/stories/blog/skull.jpg) Morton's experiments were not that famous until, more than a century later, they were rediscovered by the eminent biologist Stephen Jay Gould. And he was having none of it. According to Gould, Morton's findings were driven by his racist expectations. Caucasian should have the largest cranial capacity, so, when measuring the skulls, Morton made sure that they did, perhaps merely by subtle “unconscious or dimly perceived finagling.” Gould used this example to prove his broader point that experimental results are inevitably biased, because researchers are only human and simply cannot help but massage the data just the tiniest bit. And, as they say, if you torture the data it will confess to anything.
Morton's experiments were not that famous until, more than a century later, they were rediscovered by the eminent biologist Stephen Jay Gould. And he was having none of it. According to Gould, Morton's findings were driven by his racist expectations. Caucasian should have the largest cranial capacity, so, when measuring the skulls, Morton made sure that they did, perhaps merely by subtle “unconscious or dimly perceived finagling.” Gould used this example to prove his broader point that experimental results are inevitably biased, because researchers are only human and simply cannot help but massage the data just the tiniest bit. And, as they say, if you torture the data it will confess to anything.